SAF Round-up Q4 2025: Policy, Projects, and the Execution Signals That Matter
Time to read:
10
mins
Q4 2025 policy and regulation updates: what changed, and why it shifts “who wins”
In Q4 2025, multiple governments and regulators moved from broad encouragement to specific mechanisms that shape procurement and compliance. The highlights below are the policy moves that most directly affect project viability and offtake certainty.
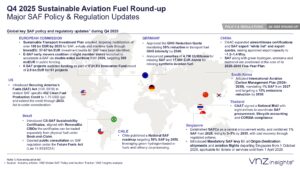
1 | European Commission: capital mobilization and auction design accelerators
2 | Germany: mandates plus hard penalties (a direct demand forcing function)
Germany’s policy posture became more “enforcement-forward.” Beyond approving a transport fuel GHG reduction trajectory, it signaled explicit penalties for missing SAF and synthetic aviation fuel targets.
3 | China: export capacity, certifications, and strategic positioning into the next plan cycle
4 | United States: SAF credit stability attempts via federal action
The US market is highly sensitive to credit continuity. When credit duration becomes legible, project FIDs become easier to underwrite.
5 | The rest of the “compliance builders”: Chile, Brazil, Singapore, South Korea, Thailand
Projects commissioned in Q4 2025: the real signal is “operating assets,” not pipeline
Commissioning matters because it converts policy demand into physical supply. VNZ Insights tracked a set of major SAF projects commissioned globally in Q4 2025, based on publicly announced information from OEMs, asset developers, and value chain players.
HEFA continues to show “near-term bankability” because feedstock and conversion risk is understood, while Alcohol-to-Jet signals pathway diversification for markets that want non-lipid scaling options.
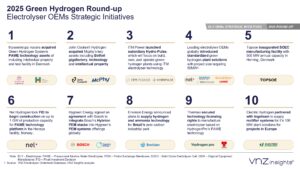
Technology orders awarded in Q4 2025: where conversion pathways are getting financed
Technology orders are the most practical indicator of execution momentum after financing. In Q4 2025, VNZ Insights noted major projects awarding firm OEM orders across multiple geographies.
Order awards are the “supply chain commitment point.” They also force early decisions on technology risk, EPC readiness, and delivery schedules. That is why this metric often predicts which announced SAF projects actually get built.
Offtake and engineering contracts in Q4 2025: demand proof and delivery proof
If policy creates demand and commissioning creates supply, contracts are what connect them. In Q4 2025, the round-up highlights both offtake contracts and project engineering contracts as a signal category.
Offtake contracts: signals that airlines and buyers are committing
Project contract snapshot: projects referenced in the Q4 round-up

What the quarter reveals: the “winner pattern” for SAF projects going forward
Cluster commentary: where the market is concentrating, and what that implies
Cluster 1: Europe as the “mechanism factory” (auctions, procurement, enforcement)
Europe is shaping the market through instrument design and compliance leverage: large capital mobilization targets, e-SAF auction formats, and penalty clarity all push the market from ambition to execution.
Cluster 2: Asia as the “scale and export capability” zone
China’s export whitelist and quota expansion indicates a deliberate push toward supply capability and trade positioning, while SAF’s inclusion in the 2026 to 2030 plan cycle signals strategic continuity.
Cluster 3: The compliance builders (Book-and-Claim, CORSIA readiness, levy systems)
Brazil, Singapore, South Korea, and Thailand are building enabling systems: certificates, procurement entities, levy structures, and airline coordination on lifecycle accounting. These moves matter because they reduce friction for SAF adoption at the airline and airport layer.
Get the full list of commissioned projects, orders, and contracts
This insight was designed to support decisions across the SAF value chain:
This round-up is part of VNZ Insights’ broader renewable fuels coverage, including policy and auction tracking, project databases, and technology OEM profiles.
This insight was powered by RFLN.
Want more insights like this?
Access live data, project trackers, and market intelligence built for OEMs, EPCs, and investors.
Download the insight/report:
Click here to DownloadSources-
https://www.linkedin.com/posts/vnzinsights_%F0%9D%97%AA%F0%9D%97%B5%F0%9D%97%BC-%F0%9D%98%84%F0%9D%97%B2%F0%9D%97%BF%F0%9D%97%B2-%F0%9D%98%81%F0%9D%97%B5%F0%9D%97%B2-%F0%9D%97%B3%F0%9D%97%BF%F0%9D%97%BC%F0%9D%97%BB%F0%9D%98%81-%F0%9D%97%BF%F0%9D%98%82-activity-7421832381109657600-1eVb?utm_source=share&utm_medium=member_desktop&rcm=ACoAACOCu3YB0vggadlGysVLxKvF97KIfrjgVCY
Image Sources-